Printing sensor values over serial is the quickest way to see what a robot's microcontroller is doing. Done carelessly, it gives you a wall of numbers you can't plot, timestamps you can't trust and data that silently goes missing. A few habits on the microcontroller side, and a small script on the computer side, turn it into a reliable data-logging tool.
Format the output for machines
Pick one format and stick to it: one line per sample, the same fields in the same order every time.
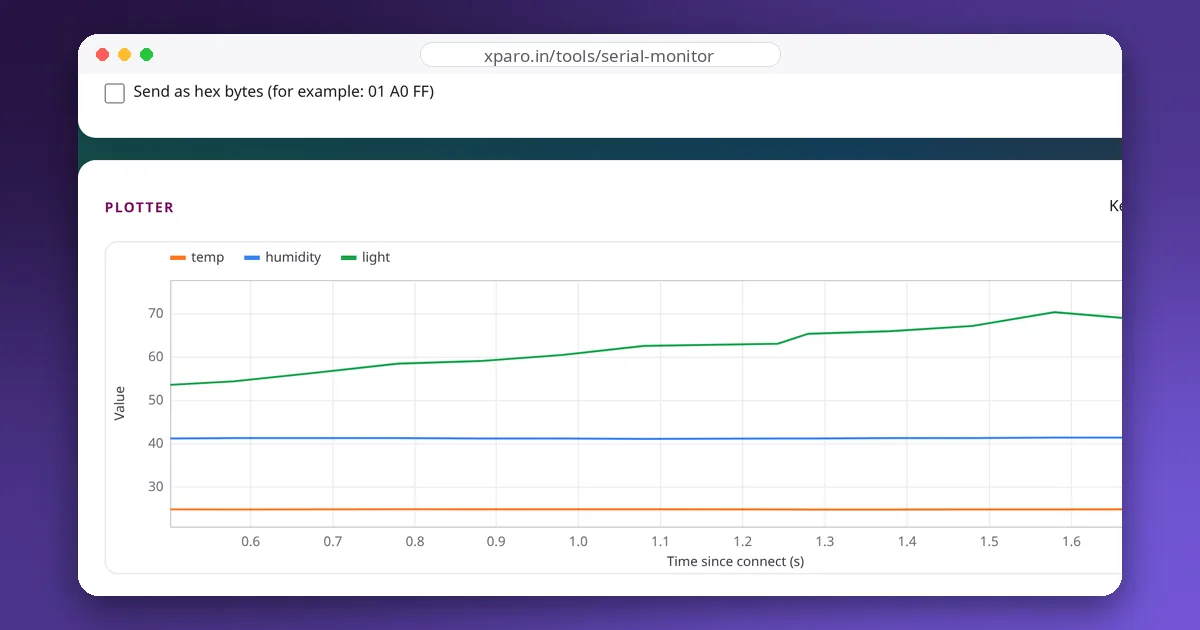
Named values are best for live plotting. The Web Serial Monitor's plotter, and the Arduino IDE's, draw one line per name:
temp:24.61,humidity:41.2,light:53.8Plain CSV with a header is best for logging and analysis:
ms,temp,humidity,light
1020,24.61,41.2,53.8
1120,24.62,41.1,54.6
Keep human-readable debug messages out of the data lines, or prefix them with a character such as # so tools can skip them.
Timestamp at the source
The time a line arrives at the computer is not the time the sample was taken: USB transfers data in bursts, and the operating system adds its own delays. Put the microcontroller's own time in every line (millis(), or micros() for fast signals). It lets you check the real sample interval, spot dropped samples (a gap in the timestamps) and compute rates such as speed from counts accurately.
Sample at a fixed rate
const unsigned long PERIOD_MS = 100;   // 10 samples per second

void loop() {
  static unsigned long last = 0;
  unsigned long now = millis();
  if (now - last < PERIOD_MS) return;
  last += PERIOD_MS;                     // stays on schedule even if one loop runs late

  Serial.print(now);
  Serial.print(',');
  Serial.print(readTemperature(), 2);
  Serial.print(',');
  Serial.println(analogRead(A0));
}
Avoid delay() for timing: the time spent reading sensors and printing adds to every interval, so the rate drifts. Avoid building lines with String concatenation in fast loops on small AVR boards, where repeated allocations fragment the tiny heap; print each field directly as above.
Respect the link's budget
A serial link carries about baud ÷ 10 bytes per second. At 115200 baud, that is roughly 11,500 bytes per second, so 40-character lines max out at under 300 per second, and you should aim well below that. If the output buffer fills, Serial.print blocks until there is room, which quietly slows your whole loop, including any control code. Options when you need more:
- Print fewer decimal places and shorter names.
- Raise the baud rate (many USB-serial chips handle 460800 or 921600).
- Use a board with native USB, where the baud setting is ignored and the link runs at USB speed.
- Average or decimate on the microcontroller, sending only what you need.
Plot live in the browser
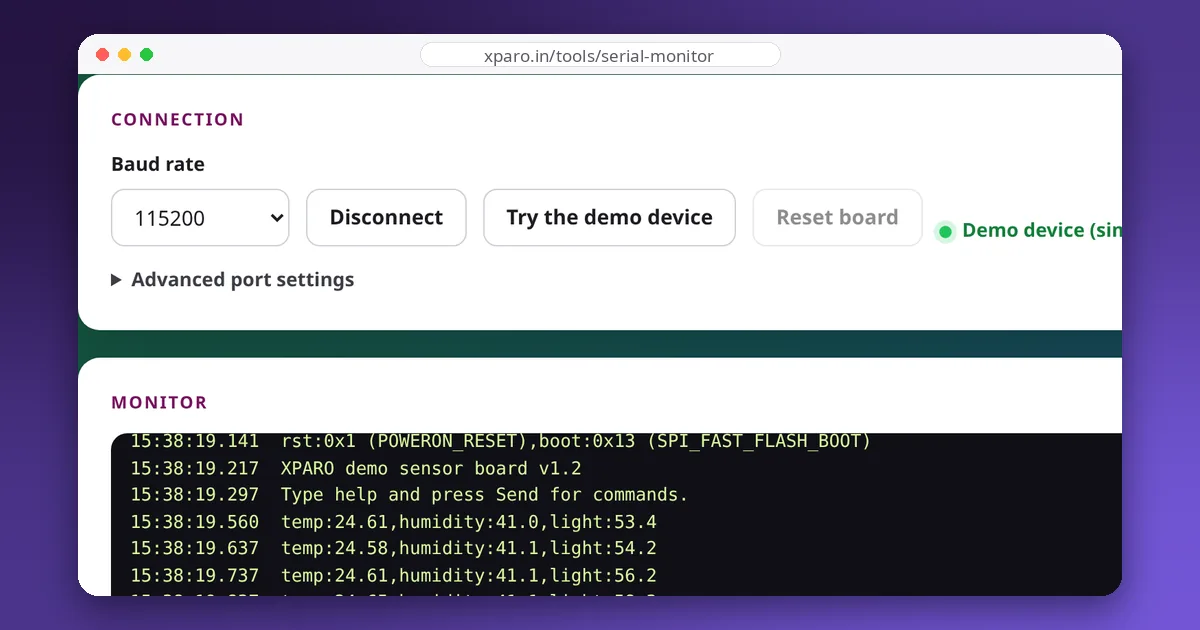
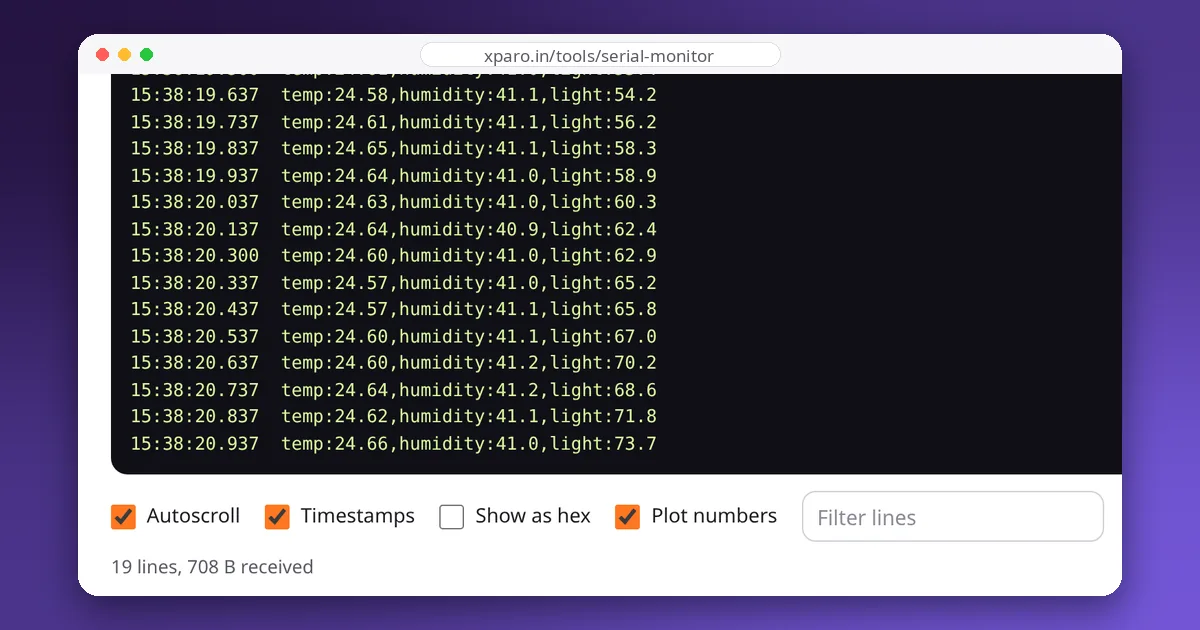
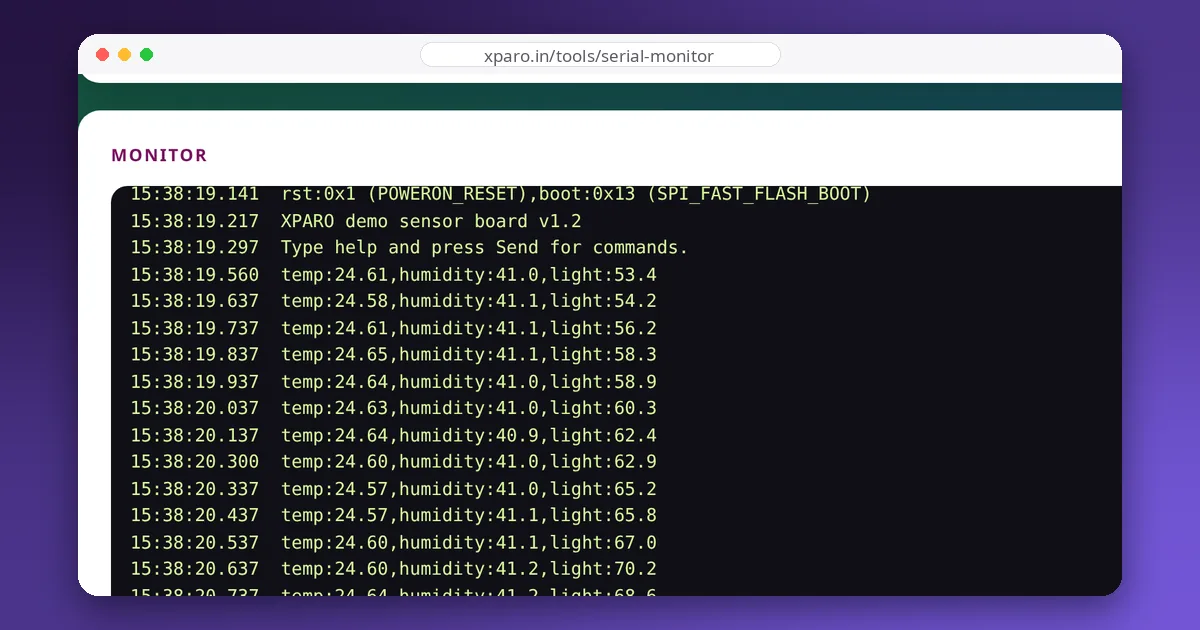
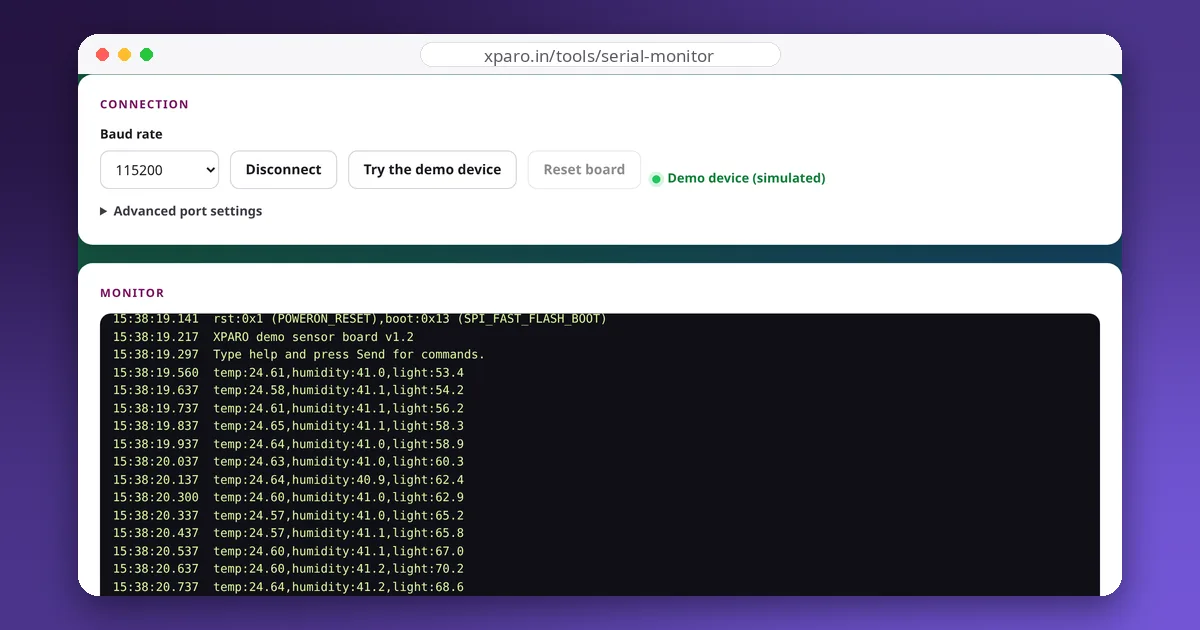
Open the Web Serial Monitor, connect at your baud rate and keep "Plot numbers" ticked. Lines of name:value pairs become named traces; plain numbers become value 1, value 2 and so on. Lines with any other words in them are shown but not plotted, so boot messages and log text don't end up on the chart. Choose how many points to keep, pause to inspect, and save the session as a text file. No hardware handy? The built-in demo device streams simulated sensor data so you can try it.
Log to a CSV file on the computer
For longer runs, log directly to disk with a few lines of Python and pyserial (pip install pyserial):
"""Log CSV lines from a serial port, adding the computer's time."""
import sys
import time

import serial

port_name, out_name = sys.argv[1], sys.argv[2]

with serial.Serial(port_name, 115200, timeout=1) as port, open(out_name, "w") as out:
    out.write("host_time,ms,temp,humidity,light\n")
    while True:
        raw = port.readline()                  # waits up to 1 s for a complete line
        if not raw:
            continue                           # no data yet, keep waiting
        line = raw.decode("utf-8", errors="replace").strip()
        if not line or line.startswith("#") or line.startswith("ms"):
            continue                           # skip debug lines and repeated headers
        out.write(f"{time.time():.3f},{line}\n")
        out.flush()                            # keep the file usable if the script is killed
Run it with python3 log_serial.py /dev/ttyUSB0 run1.csv and stop it with Ctrl+C. We tested this loop against a simulated device sending 50 lines per second: every line arrived in the file. Using readline() with a timeout means the script waits for whole lines, and flushing after each write means a crash loses at most one line.
Check the data before you trust it
- Look for gaps in the microcontroller timestamps; they reveal dropped lines or a stalled loop.
- Compare the two clocks. Host time and device time drift slowly apart; for analysis, trust the device's intervals and the host's absolute time.
- Watch for resets. A device timestamp that jumps back to near zero means the board rebooted mid-run, often a sign of a power brownout.
When the data is going into ROS, logging it as a ROS topic with ros2 bag record is often better still; our guide to a serial protocol for ROS 2 shows how to bridge the microcontroller into topics.